When several surface coatings are available for an implantable device, how do you know which one is the best choice?
One of our customers recently developed a potential new implantable device designed for use inside human body. Several surface coating formulations had already been developed, but the team faced a critical decision point: which one is the most compatible with living cells…?
For implantable materials, the surface is the first point of interaction between the device and surrounding tissue. The way cells respond to that surface can influence how well the material integrates with the body and, ultimately, its performance.
Rather than relying on assumptions, our customer wanted clear biological data to help guide the selection the of most promising coating.
To support this decision, we designed a 4-step in vitro cell-based testing strategy to evaluate how living cells responded to different coated steel discs.
Instead of looking at just one biological endpoint, we progressively assessed the materials from different perspectives—from cell viability and appearance to attachment and cellular behavior.
Here is how we approached it.
Step 1: Are the Cells Healthy?
MTT Cell Viability Assay
We started with the most fundamental question: Does the materials cause any potential toxic effects on living cells…?
To answer this, we performed MTT cytotoxicity assay in accordance with ISO 10993-5:2009, an internationally recognized standard for biological safety.
Cells were exposed to extracts prepared from the different coated steel discs at a range of concentrations. Cell viability was then assessed based on metabolic activity, providing an indication of how well the cells tolerated the materials under the test conditions.
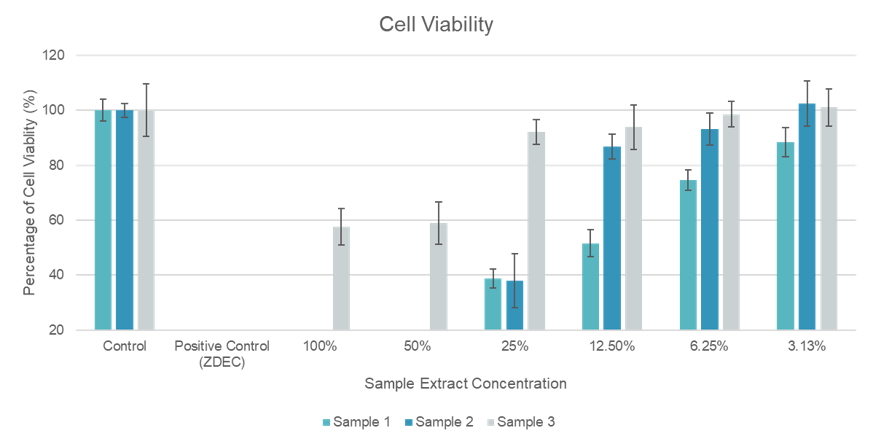
At lower extract concentrations, the coatings were generally well tolerated, with high cell viability observed across the samples. At higher concentrations, differences between the coatings became more apparent.
Overall, Sample 3 performed best, with higher cell viability at all concentrations. In contrast, Samples 1 and 2 showed much lower cell viability, especially at higher concentrations, suggesting lower cell compatibility. These differences may be due to variations in the coating composition and surface properties.
Figure 1: Cell viability using MTT assay. Cells were exposed to serial dilutions of extracts (100% to 3.13%) from three coating formulations (Sample 1–3). Viability was measured relative to untreated controls and compared against negative and cytotoxic controls (ZDEC), showing concentration-dependent responses.
Step 2: How does the Cells look like?
Acridine Orange staining
Numbers tell us one part of the story. The microscope can tell us another.
We next used Acridine Orange (AO) staining to visually assess the cells and observe differences in their appearance and distribution across the tested surfaces.
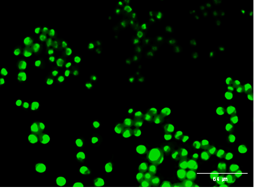
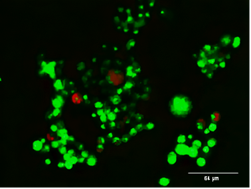
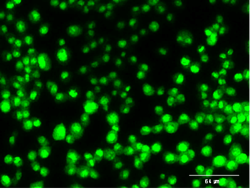
Healthy, viable cells showed predominantly green fluorescence, while differences in fluorescence patterns and cell morphology were observed between the coatings.
Sample 3 showed a predominantly healthy-looking cell population, consistent with the previous MTT results. Samples 1 and 2 showed fewer healthy cells, with Sample 2 showing more reddish-orange fluorescence, indicating damaged cells.
This visual assessment complemented the quantitative viability data, helping us better understand how the cells were responding to each coating.
Sample 1
Sample 2
Sample 3
Figure 2. Acridine Orange staining of cells cultured on Sample 1–3 coatings. Representative fluorescence images demonstrate differences in cell distribution and viability across test surfaces.
Step 3: Can the Cells Attach to the Surface?
The Attachment Assay
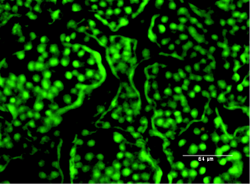
For implantable materials, cell attachment can be an important factor when evaluating how cells interact with a material. We, therefore seeded cells directly onto the coated steel discs and assessed both the extent of cell attachment and how evenly the cells were distributed across the surface.
The results showed clear differences between the coatings.
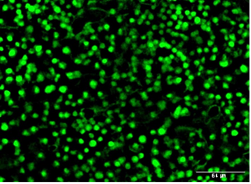
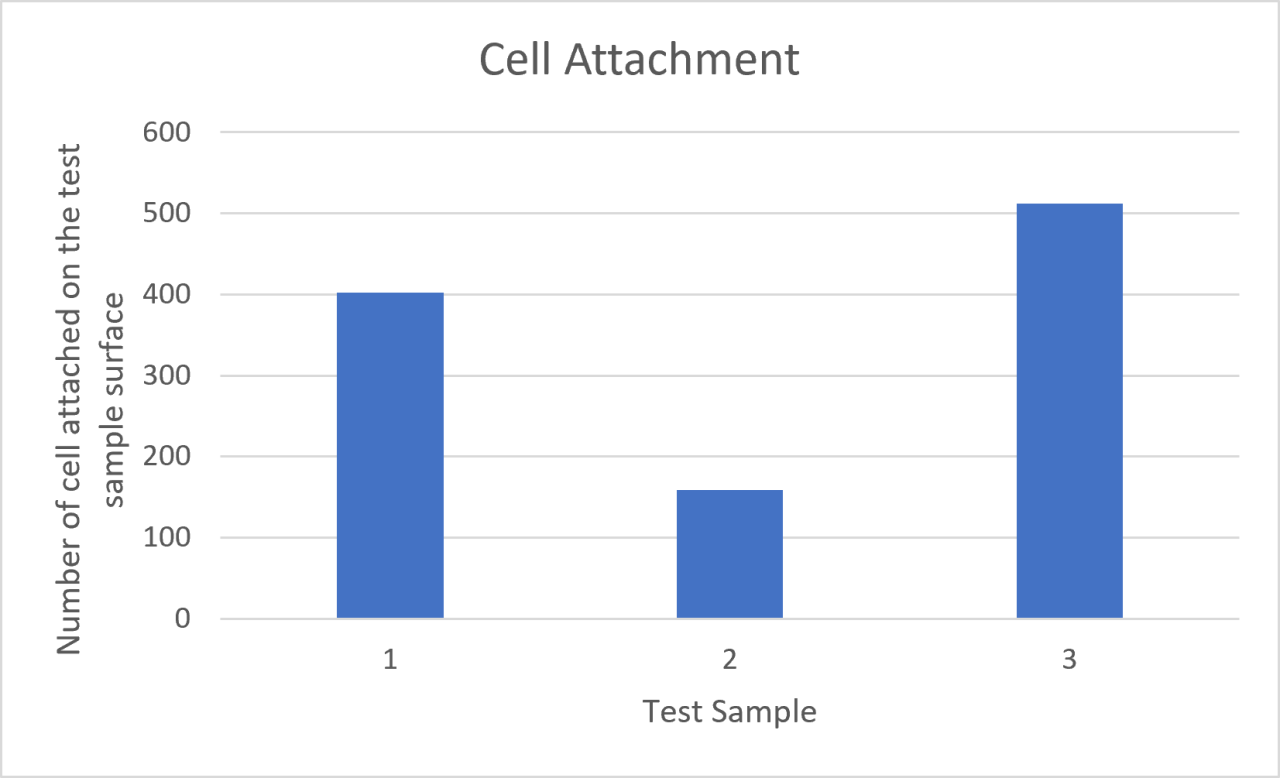
Sample 3 demonstrated a high density of attached cells with relatively even distribution, suggesting a favorable interaction between the cells and the coated surface.
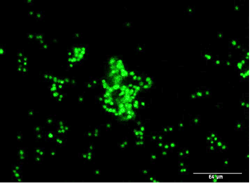
Sample 1 also supported substantial cell attachment, although the cells were distributed less evenly across the surface. This may be due to differences in the surface characteristics of the coating.
In contrast, Sample 2 showed fewer attached cells, indicating a less favorable surface for cell attachment under the conditions tested.
These findings highlight an important point: a material may be well tolerated by cells, but that does not necessarily mean that cells will interact with its surface in the same way.
Sample 1
Sample 2
Sample 3
Figure 3. Cell attachment on different coatings assessed by AO staining. Top panel shows fluorescence images of attached cells; bottom panel quantifies cell attachment across samples. Surface properties were found to significantly influence adhesion and distribution.
Step 4:Can the Cells Remain Attached and Function Normally?
Scratch (Wound Healing) Assay
By this stage, we had confirmed that the cells could attach on the coated surfaces. But one important question…?
Could the cells remain on the surface and demonstrate functional behavior over time?
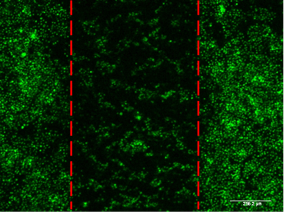
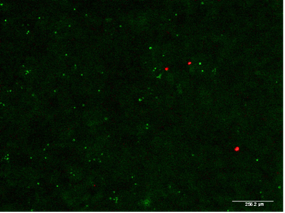
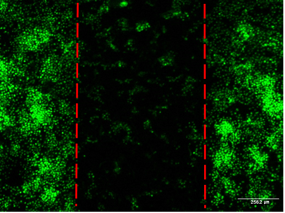
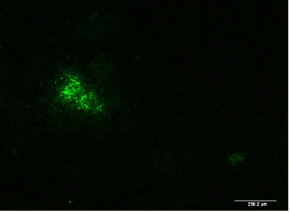
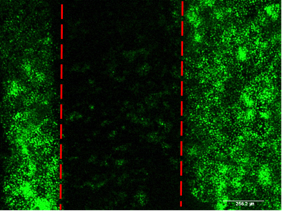
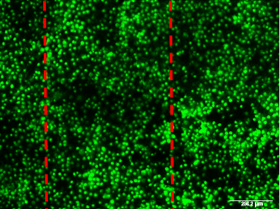
To find out, we performed a scratch (wound healing) assay. By creating a small, uniform gap in the cell layer, we were able to observe how the cells responded—specifically, whether they remained attached and proliferate across the coated surface to close the gap.
The differences between the coating became even more apparent.
Sample 3 retained a healthy population of attached cells. More importantly the cells migrated into the scratched area, resulting in a “wound closure”. This suggests that the coating supported not only initial cell attachment, but also the functional behavior of the cells.
In contrast, Sample 1 & 2 told a very different story. Following the incubation, little to no cells remained attached to the coated discs, leaving the scratch area largely devoid of cells. As a results, gap closure could not be assessed for these samples.
The results highlight why evaluating a biomaterial using multiple complementary assays can be valuable. A coating may support initial cell attachment, but further testing may reveal additional aspects of how cells behave on the material over time.
Sample 1
Sample 2
Sample 3
Figure 4: Representative fluorescence images of Acridine-orange-stained cells in a scratch assay on Sample 1–3 coatings. Dashed lines indicate the scratch region, with green fluorescence representing viable cells.
Which Coating Should Move Forward?
Based on the results, Sample 3 stands out as the most promising coating compared to Samples 1 and 2. It showed higher cell viability, more healthy-looking cells, and better cell attachment and distribution on the surface. Samples 1 and 2 showed less favorable cell responses, particularly at higher concentrations, with Sample 2 showing more signs of cell damage.
Sample 3 would be the best candidate to take forward. From here, further biocompatibility, safety, and performance testing can help build a stronger understanding of the material’s suitability for the medical device and support its potential for future clinical use.
From biomaterials to finished products, our team offers a range of in vitro biocompatibility and toxicology testing services—including cell-based assays and reconstructed human tissue models
Talk to our team to develop a testing strategy tailored to your product and development needs.


 Deutsch
 中文
中文
 日本語
日本語
 Português
 Français
 Español
 العربية